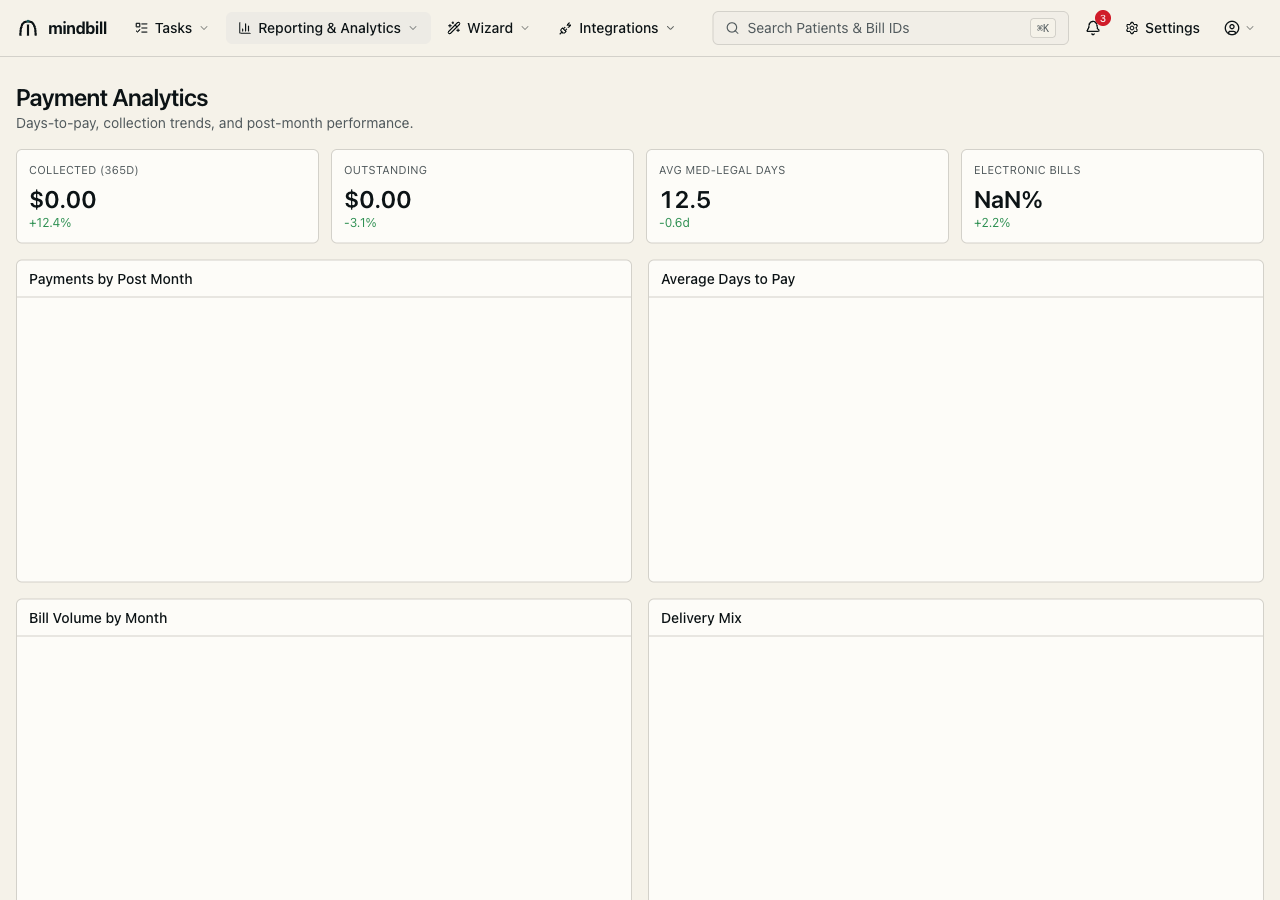
Step 1 — Open Payment Analytics
From Reporting & Analytics, open Payment Analytics. ① The top row shows your headline KPIs: total collected (trailing 365 days), outstanding A/R, average days-to-pay, and electronic-bill percentage. ② The Average Days to Pay chart splits e-bill (~10 days) from paper (~38) — the case for pushing everything to EDI. Each tile shows the trend versus the prior period.
Step 2 — Read the trends
Below the headline tiles, Payments by Post Month and Bill Volume by Month chart your throughput over time, so you can see whether collections are keeping pace with the bills you send. The Delivery Mix pie breaks down how your bills are routed across electronic, fax, and paper. Scroll to Days-to-Pay by Claims Administrator to rank payers by turnaround and spot the ones slow-walking you — those slow payers are your audit-complaint and follow-up targets.